![]() SRS 102-5
SRS 102-5 ![]() SRS 103-1
SRS 103-1 ![]() SRS 103-3
SRS 103-3 ![]() SRS 201-1
SRS 201-1
2017 was a year of historic results for GFNorte, with indicators demonstrating once again our strong performance and profitability.
Net Interest Income (NII) for GFNorte grew 19% annually reaching Ps 63.366 billion in 2017. The aforementioned driven mainly by NII, excluding Insurance and Annuities, that totaled Ps 56.850 billion in 2017, 21% higher than in 2016, due to the positive effects of the phased rate increases by Banxico (for a total of +150bp in 2017), as well as by a more profitable mix in the loan portfolio and a more controlled funding cost. NII for Insurance and Annuities totaled Ps 6.517 billion, 8% higher than in the previous year, affected by a one-time Ps 565 million impact due to accounting changes resulting from the Solvency II regulation that impacted the Insurance company’s NII in 2016; without this effect, NII for the Insurance and Annuities’ companies would have increased 19% annually.
In 2017 net interest margin (NIM) was 5.5%, representing an annual increase of 60bp versus 2016. This growth is a result of a more profitable portfolio mix, a healthy funding cost and the effects of the balance repricing by the interest rate cycle.
Provisions charged to results for 2017 were Ps 15.214 billion, 14% more than for last year.
This increase is explained by requirements in the sectors of the consumer portfolio with more dynamic growth (credit cards, payroll and personal loans), despite the reduction in provisions for the mortgage and government portfolios.
Provisions accounted for 24% of the net interest income in the year, 1.1 pp lower than in 2016. Provisions represented 2.6% of the loan portfolio average in 2017, 8 bp higher versus 2016.
In 2017 Non-Interest Income was Ps 17.852 billion, an 8% annual increase, driven by growth in net service fees that totaled Ps 11.983 billion, 13% higher than for last year, in turn supported by a 19% growth in basic bank service fees due to a greater volume of transactions (highlighted by the performance of electronic banking), a 17% increase in consumer loan fees due to more origination fees, a 39% in consultancy and brokerage fees and 15% in investment funds.
In 2017 non-interest expenses totaled Ps 34.061 billion, 9% higher than in 2016, as a result of an increase in all items (with the exception of caused Statutory Employee Profit Sharing), the effect of higher inflation registered in the year and fees paid for reported expenses linked to a relevant transaction.

“ Net interest income (NII) for GFNorte increased by 19% annually reaching Ps 63.366 billion in 2017, driven mainly by NII, excluding Insurance and Annuities, that reached Ps 56.850 billion in 2017, 21% higher than in 2016.”
The efficiency ratio improved steadily during 2017 to close at 41.9%, (300 bp) lower annually as a result of a positive operating leverage. This has allowed us to extend our tendency with historically low efficiency ratio levels.
![]() SRS 201-1
SRS 201-1
Net profits were Ps 23.908 billion, 24% higher annually, a result of the positive trend observed in net interest and non-interest income. This profit is comprised of solid growth in the subsidiaries’ net profits: Bank 30%, Annuities 57%, Insurance 6% (despite a very complicated year plagued by natural disasters), Leasing 11%, Warehouse 48%, Brokerage 16% and Operadora de Fondos 19%.
Return on equity (ROE) increased 307 bp, going from 13.9% to 17%, while return on assets (ROA) grew 28 bp to 1.86%. Return on tangible equity (ROTE) for 2017 was 20.9%, 353 bp higher than that reported in 2016. Return on risk-weighted assets was 3.8%, 66 bp higher than last year.
Total performing loans increased by 9% annually reaching Ps 615.525 billion by year-end. Although there was a slight decline in overall growth, it was offset by the outstanding annual performance of +19% in the consumer portfolio, a growth higher than that presented by the banking system and a reflection of the bank’s origination capabilities, underpinned with technology and analytics. For their part, the Commercial, Corporate and Government portfolios demonstrated moderate growth dynamics very similar to the market growth.
| LOAN PORTFOLIO | |||
|---|---|---|---|
| 2017 | 2016 | 2015 | |
| Mortgages | 135,334 | 114,718 | 99,825 |
| Car loans | 19,189 | 15,047 | 12,400 |
| Credit cards | 33,906 | 28,445 | 24,854 |
| Payroll loans | 52,469 | 44,838 | 38,482 |
| Consumer | 240,899 | 203,047 | 175,561 |
| Commercial | 137,501 | 125,377 | 124,272 |
| Corporate | 102,220 | 103,491 | 88,108 |
| Government | 134,905 | 134,798 | 130,119 |
| Subtotal | 615,525 | 566,713 | 518,059 |
| Recovery bank | 72 | 91 | 129 |
| Total performing loans | 615,598 | 566,804 | 518,188 |
| Past due loans | 12,482 | 10,312 | 11,903 |
| NPL ratio | 2.0% | 1.8% | 2.2% |

“ Total performing loans increased by 9% annually reaching Ps 615.525 billion at year end.”
The NPL ratio was 2%. Past due loans reached a total of Ps 12.482 billion, an increase of Ps 2.170 billion, reflecting an annual growth of 21%. A slight deterioration was observed in the Consumer and Corporate portfolios while the Commercial portfolio demonstrated remarkable improvement.
At the close of 2017, total deposits reached the amount of Ps 648.622 billion, representing an annual variation of +13%, driven mainly by growth in term deposits and the money market during the year. This shows that clients are migrating to products that pay interest given the current cycle of high rates, and explains the annual growth in client deposits of 12% and total assets under administration of 11%.
| DEPOSITS | |||
|---|---|---|---|
| 2017 | 2016 | 2015 | |
| Demand deposits – without interest | 239,227 | 231,394 | 169,611 |
| Demand deposits – with interest | 157,425 | 152,367 | 167,275 |
| Demand deposits | 396,652 | 383,761 | 336,886 |
| Term deposits – teller | 193,617 | 167,652 | 149,733 |
| Money market | 58,352 | 24,342 | 54,907 |
| Total bank deposits | 648,622 | 575,755 | 541,526 |
| Total GFNorte Deposits | 640,821 | 574,559 | 539,318 |
| Third party deposits | 157,748 | 148,407 | 139,099 |
| Total assets under management | 806,370 | 724,163 | 702,769 |

The income tax rate applicable to companies in Mexico is 30%. GFNorte’s fiscal policy establishes keeping a correct record of operations that will enable the company to take advantage of all the benefits for the company within the legal fiscal framework while at the same time complying promptly with obligations. In GFNorte we look for that interpretation and internal enforcement of such laws that does not lead to the generation of high risks or future tax contingencies for the Group and/or its subsidiaries. In 2017, the effective tax rate for GFNorte was 27.2%.
| HISTORICAL TAX RATE % | |
|---|---|
| Year | Rate |
| 2015 | 26.0 |
| 2016 | 26.2 |
| 2017 | 27.2 |

| INTERNATIONAL RANKING - GFNORTE | ||||
|---|---|---|---|---|
| Rating Agency | Rated Institutions | Rating | Category | Date |
| Standard & Poor’s | Banco Mercantil del Norte | Stable | Outlook | July 2017 |
| BBB+ | Counterparty credit - Long term foreign currency | |||
| BBB+ | Counterparty credit - Long term local currency | |||
| A-2 | Counterparty credit – Short term foreign currency | |||
| A-2 | Counterparty credit – Short term local currency | |||
| BBB | Senior debt | |||
| BB | Subordinated junior debt | |||
| Fitch | Grupo Financiero Banorte | Stable / Negative | Outlook / Observation | October 2017 |
| bbb+ | Viability | |||
| BBB+ | Long term foreign currency debt | |||
| F2 | Short term foreign currency debt | |||
| 5 | Support rating - GFNorte | |||
| NF (Not Floor) | Support rating floor - GFNorte | |||
| Banco Mercantil del Norte | Stable / Negative | Outlook / Observation | ||
| bbb+ | Viability | |||
| BBB+ | Long term foreign currency debt | |||
| F2 | Short term foreign currency debt | |||
| C | Individual – foreign currency | |||
| BBB- | Support rating floor | |||
| 2 | Support rating - Banco Mercantil del Norte | |||
| BB+ (EXP) | Long term foreign currency subordinated debt | |||
| BB | Subordinated Junior Notes (from the merged Ixe Bank) | |||
| Moody’s | Banco Mercantil del Norte | Negative | Outlook BFSR | September, 2016 |
| baa2 | Credit risk assessment | |||
| Negative | Outlook | |||
| A3 | Long term local currency deposits | |||
| A3 | Long term foreign currency deposits | |||
| P-2 | Short term local currency deposits | |||
| P-2 | Short term foreign currency deposits | |||
| A3 | Long term foreign currency senior debt | |||
| Baa3 | Long term local currency subordinated debt | |||
| Baa2 (hyb) | Long term foreign currency subordinated debt | |||
| Ba1 (hyb) | Long term local currency junior subordinated debt | |||
| (P)Ba1 (hyb) | Long term foreign currency subordinated debt | |||
| Ba1 | Long term foreign currency junior subordinated debt | |||
| baa2 | Adjusted baseline credit assessment | |||
| A2 (cr) | Long term counterparty risk assessment | |||
| Prime-1 (cr) | Short term counterparty risk assessment | |||
| Arrendadora y Factor Banorte | Stable | Outlook | November 2016 | |
| (P)P-2 | Short term local currency issuer | |||
| (P)P-2 | Short term local currency senior debt | |||

| Calificaciones NACIONALES GFNorte | ||||
|---|---|---|---|---|
| Rating Agency | Rated Institutions | Rating | Category | Date |
| Standard & Poor’s | Banco Mercantil del Norte | Stable | Outlook | March 2017 |
| mxA-1+ | National scale counterparty credit – short term | |||
| mxAAA | National scale counterparty credit – long term | |||
| Casa de Bolsa Banorte Ixe | Estable | Outlook | ||
| mxA-1+ | National scale counterparty credit – short term | |||
| mxAAA | National scale counterparty credit – long term | |||
| Fitch | Banco Mercantil del Norte | Stable / Negative | Outlook / Observation | October 2017 |
| AAA (mex) | National scale counterparty credit – long term | |||
| F1+ (mex) | National scale counterparty Credit – short term | |||
| F1+ (mex) | Certificate of deposit and P.R.L.V. – short term | |||
| AA+ (mex) | National scale counterparty credit – long term | |||
| Casa de Bolsa Banorte Ixe | Stable / Negative | Outlook / Observation | ||
| F1+ (mex) | National scale counterparty credit – short term | |||
| AAA (mex) | National scale counterparty credit – long term | |||
| Arrendadora y Factor Banorte | F1+ (mex) | National scale counterparty credit – short term | ||
| AAA (mex) | National scale counterparty credit – long term | |||
| F1+ (mex) | National scale unsecured debt – short term | |||
| AAA (mex) | National scale counterparty credit – long term | |||
| Almacenadora Banorte | F1+ (mex) | National scale counterparty credit – short term | ||
| AAA (mex) | National scale counterparty credit – long term | |||
| Pensiones Banorte | Stable / Negative | Outlook / Observation | ||
| AAA (mex) | National scale | |||
| Seguros Banorte | Stable / Negative | Outlook / Observation | ||
| AAA (mex) | Financial strength of insurer | |||
| Moody’s | Banco Mercantil del Norte | Negative | Outlook | June 2016 |
| Aaa.mx | National Scale deposits – long term | |||
| MX-1 | National Scale deposits – short term | |||
| Aa3.mx | Subordinated debt – long term | |||
| A1.mx | Subordinated junior debt – Long term | |||
| Arrendadora y Factor Banorte | Stable | Outlook | November 2016 | |
| MX-1 | National Scale - Short term issuer | |||
| Aa2.mx | National scale - senior debt – long term | |||
| MX-1 | National scale - senior debt – short term | |||
| HR Ratings | Banco Mercantil del Norte | Stable | Outlook | May 2016 |
| HR AAA | Long term obligations | |||
| HR+1 | Short term obligations | |||
| HR AA+ | Preferred subordinated obligations | |||
Being a public company with wide recognition and listed in the Mexican stock market, we are committed to following the highest standards in corporate governance, disclosure of information and communication with our investors and stakeholders.
Grupo Financiero Banorte’s shareholder base is globally diversified, consisting of individuals and institutional investors. Throughout the Group’s institutionalization process, we developed various strategies to expand our shareholder base and become an option for those seeking a long-term investment or a growing recognition through dividends.
We are a financial group that listens to and cares about its shareholders. One example of this is the amendment to our bylaws and the changes to the Nominating Committee, actions that were made after taking into account the recommendations and concerns expressed by our investors.
We work continuously to strengthen our relationship with the community, investors, analysts and rating agencies, seeking to expand our communication channels. In 2017 we mainly did so through innovation in our digital platform and increased detail in our information disclosures, all the while evolving our financial group.
In addition, we have maintained our traditional channels: quarterly and annual reports, quarterly conferences, roadshows, non-deal roadshows and attendance to various international and national stock exchange conferences.
In particular, in 2017:
GFNorte has also developed a solid strategy through which we support efforts to achieve sustainable development in our daily operations and the requirements of our shareholders.
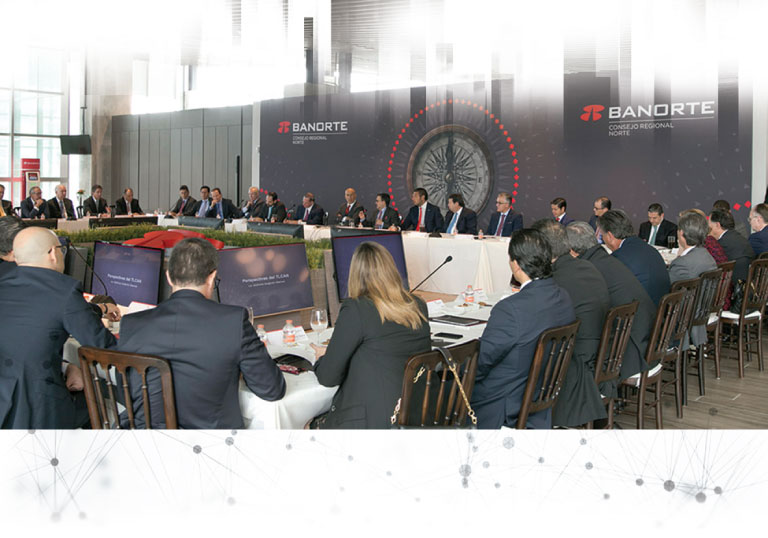
With regard to our corporate governance, In 2017 we held four Ordinary and one Extraordinary Shareholders’ Assemblies, with an average assistance of 80% of the shareholders. Initiatives proposed in these assemblies were all approved during the session.
We will continue to strengthen the relationship with our investors, because we are convinced that constant and efficient communication and increased transparency are the way forward in order to keep us as a reference in the field of corporate governance and transparency of information.

“ We are committed to following the highest standards of corporate governance, disclosure of information, and communication with investors and stakeholders.”
In 2017 we held four Ordinary Shareholders’ Assemblies registering a high participation of shareholders, which exceeded the required quorum of assistance established in the Group’s statutes. We also held an Extraordinary Shareholders’ Assembly in which participation was 81.26% of the share capital, exceeding the minimum requirement of 70% stipulated in the Group’s statutes. In all cases, submitted resolutions were approved by a majority vote.
We have an established process for the development of Shareholders Assemblies and to facilitate information, participation and voting. In this way, the Group convenes assemblies with a minimum of 30 calendar days in advance of the date of execution, via the email address: investor@banorte.com.
Additionally, we have the services of an internationally recognized firm that does a comprehensive job of shareholder engagement to ensure that they are well informed, address questions and doubts, as well as ensure assistance at the assemblies. Similarly, two prestigious international firms providing voting proxy services, follow-up on Shareholders’ Assemblies of the Group and prepare reports of recommendations on proposals, in order to analyze each one and provide support to shareholders for the vote.
All votes are received and registered in an international electronic platform—dedicated to this purpose and well known in the market—to register the votes and verify the Shareholder’s identity.
For more information please go to: https://www.banorte.com/ri

| SHAREHOLDERS’ ASSEMBLIES | ||||
|---|---|---|---|---|
| Date | General Shareholders’ Assemby | Quorum % |
Average in favor vote of shares represented in assemblies % |
Average in favor vote of total equity % |
| February 24th, 2017 | Ordinary | 80.71 | 99.99 | 80.71 |
| April 28th, 2017 | Ordinary | 80.06 | 99.39 | 79.58 |
| June 20th, 2017 | Ordinary | 77.68 | 99.98 | 77.66 |
| December 5th, 2017 | Ordinary | 81.26 | 79.91 | 64.93 |
| Extraordinary | 81.26 | 83.01 | 67.45 | |
